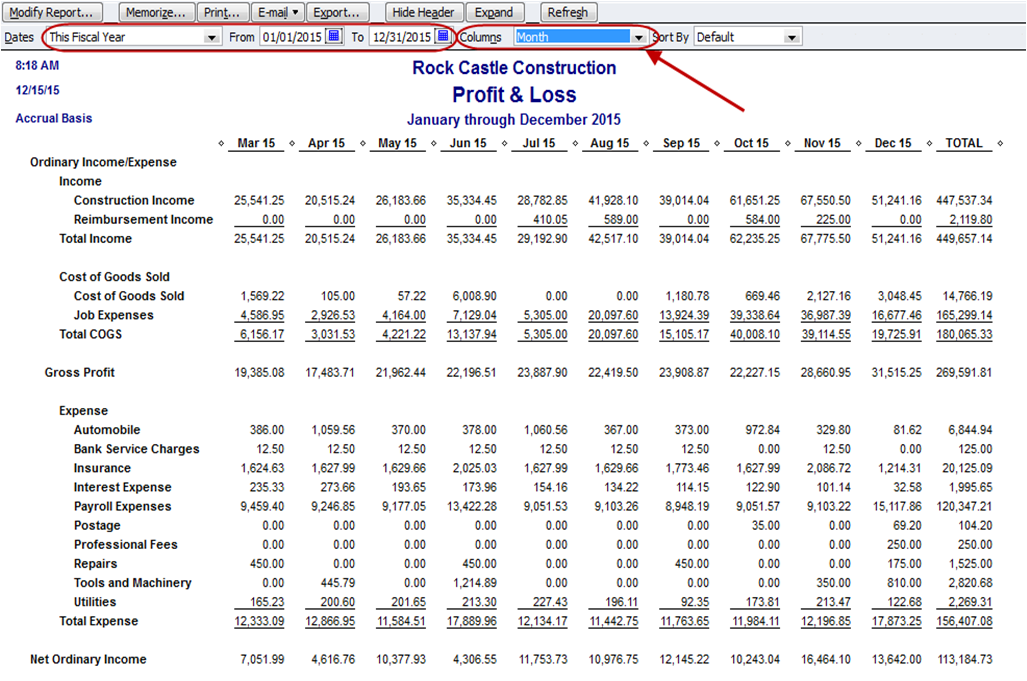
Is it possible to write a custom report that has multiple months along the top? For example, if I run the report from Dec 2013 to Feb 2014, there will be a column for each month (Dec, Jan & Feb) with a Total column at the end. I see that a chart can be generated with that data, but I cannot see how to run a report.
I have tried Custom Reports, but I can’t get it to do what I want. For example, lets say I want a P&L report for the months from Dec 13 to Feb 14, with a column for each month and a total at the end. Can that be done?
It wont show on screen like that but as alternative you can generate monthly P&L report and export to CSV, same for other months and within few minutes you will have your required report in excel
Hi Glenn
I have seen the charts, which are great, but not what I’m after. I’ll try and attach an image of a Quickbooks report that shows what I mean.
Thanks
Gary
OK so you’re looking for a monthly P&L with the breakdown. The P&L report we have will not show data side-by-side in this way for a given period. We do intend to develop some advanced reports that will cater for these scenarios this will form part of the Affinity system. At the moment I’m afraid I don’t have any timescales for this.
I’ve switched this to a feature request now so we can track it and update you in future.
Hi Glenn
Will that report be available to non Affinity customers soon? I’m happy to pay for Affinity to get access to the report, but it seems to be an unnecessary additional step in my case.
I’m afraid we don’t have any plans to do this. We are developing an advanced set of reports for Affinity that provide more granular data for accountants and bookkeepers. The P&L is the first in this series.